Burn accidents happen in an instant, leaving people unsure how serious the injury truly is. That’s where a burn degree chart becomes invaluable. From my own experience working with wound care specialists, I’ve seen how a chart isn’t just medical theory—it’s a quick decision-making guide that helps you separate a simple burn that heals at home from one that requires urgent treatment. This article will explain what each burn level reveals, share real-world cases where recognition made all the difference, and outline steps for safer, faster recovery.
Top Takeaways
- Recognize severity fast. A burn degree chart helps you distinguish minor redness from blistering or deep tissue damage.
- First aid matters. Cool water and sterile gauze help; butter, oils, or ice make injuries worse.
- Know danger signs. Large, deep, or sensitive-area burns (face, hands, feet, genitals) need immediate care.
- Be prepared. Keep a chart and stocked first-aid kit accessible at home and work.
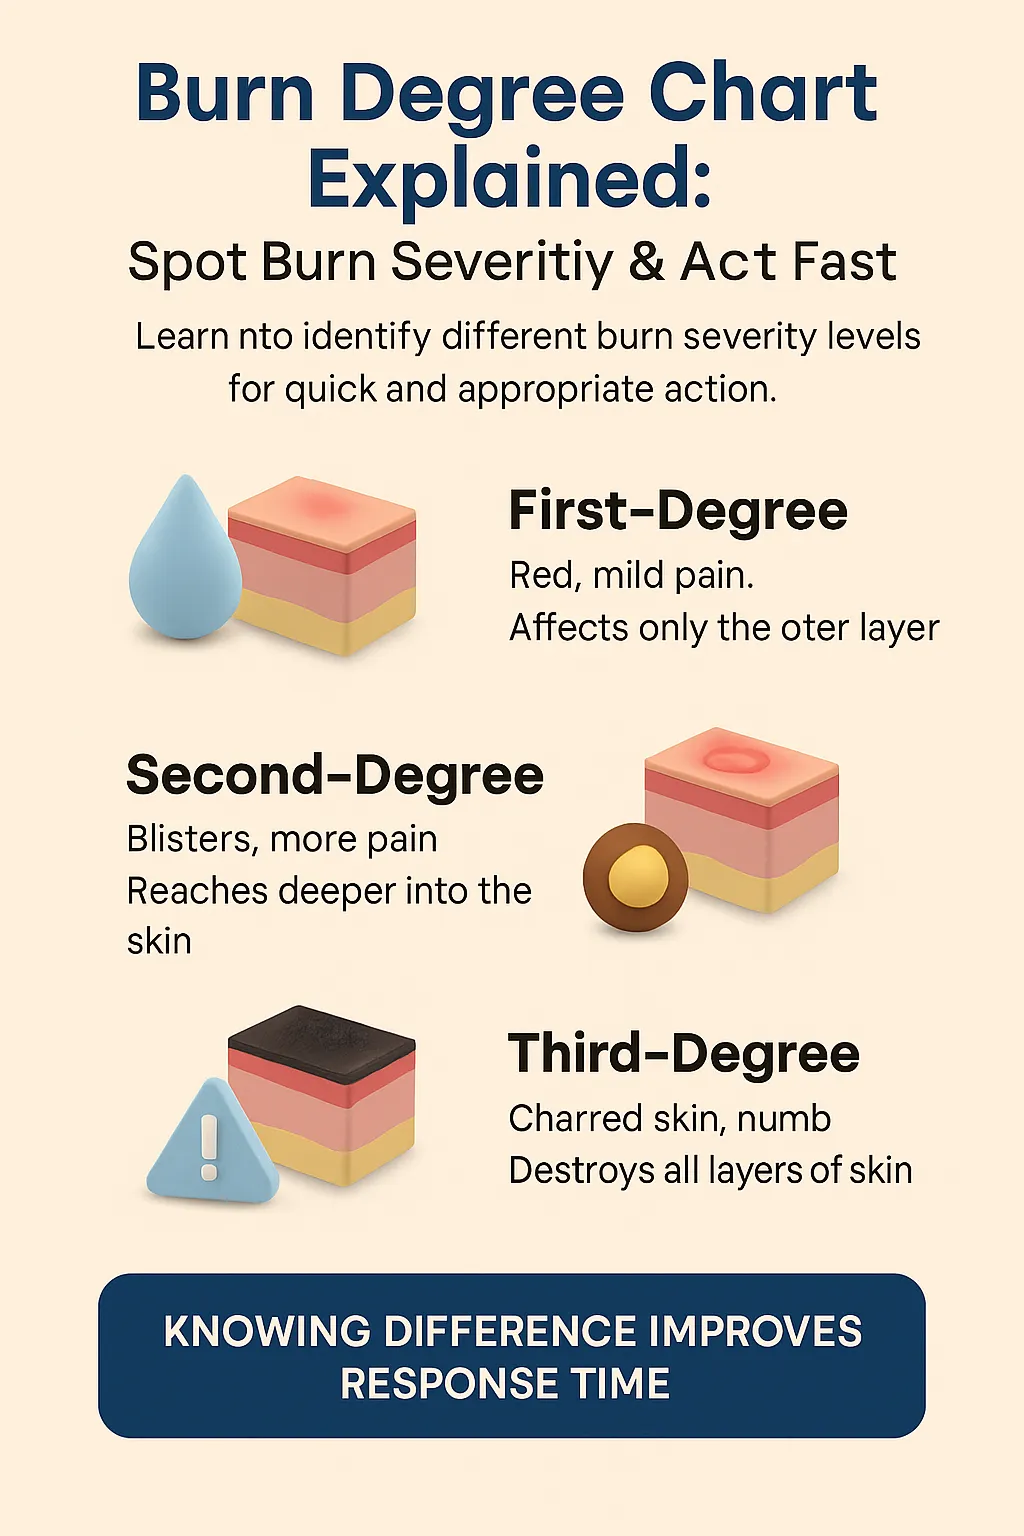
What a Burn Degree Chart Reveals
- First-Degree Burns – Affect only the top layer of skin. Symptoms: redness, slight swelling, mild pain. Heal within a week with basic first aid.
- Second-Degree Burns – Extend into the dermis. Symptoms: blisters, swelling, intense pain. May scar if untreated; recovery takes weeks.
- Third-Degree Burns – Destroy all skin layers, sometimes reaching fat tissue. Skin appears waxy, leathery, or charred; may feel less painful due to nerve damage. Require urgent hospital care.
- Fourth-Degree Burns – Penetrate muscle, tendons, or bone. Extremely dangerous, life-threatening emergencies needing immediate intervention.
Insight: Knowing these levels means knowing when to act fast and when home care is enough.
Expert Perspective
“In practice, I’ve seen countless burns underestimated. A burn degree chart is more than terminology—it’s a lifesaving guide that shows when a blister is harmless and when tissue damage needs immediate emergency care. Acting early can mean faster healing and avoiding permanent complications.”
Case Studies & Real-World Examples
Kitchen Burn Misread
Hot water caused redness that seemed minor. Blisters later revealed a second-degree burn. The chart helped confirm severity, and proper treatment prevented infection and scarring.
Workplace Burn Emergency
A factory worker burned his arm on heated equipment. Pale, leathery skin with low pain suggested a third-degree burn. The chart guided quick recognition, leading to hospital care and a successful skin graft.
Research Backing
Studies show burns are often misclassified by non-specialists. Burn degree charts increase accuracy, leading to faster treatment and safer recovery outcomes.
Supporting Statistics
32,500+ patients treated in U.S. burn centers in 2023; over 156,000 admissions in the past 5 years (American Burn Association – Burn Statistics).
13,000+ civilian fire injuries in 2023, nearly 40 injuries per million people (U.S. Fire Administration – Fire Data & Statistics).
80,000 children under 19 treated for burns each year; about 300 deaths annually (CDC – Fire Prevention & Burns).
Scald injuries cause about 35% of burn admissions, with over half affecting children under five (American Burn Association – Scald Prevention).
Key Insight: These numbers highlight what I’ve seen firsthand—delays in recognizing severity lead to worse outcomes, while charts drive faster, safer responses.
32,500+ patients treated in U.S. burn centers in 2023; over 156,000 admissions in the past 5 years (American Burn Association – Burn Statistics).
13,000+ civilian fire injuries in 2023, nearly 40 injuries per million people (U.S. Fire Administration – Fire Data & Statistics).
80,000 children under 19 treated for burns each year; about 300 deaths annually (CDC – Fire Prevention & Burns).
Scald injuries cause about 35% of burn admissions, with over half affecting children under five (American Burn Association – Scald Prevention).
Final Thought & Opinion
Burn degree charts should be as common as first-aid kits. I’ve seen small burns misclassified and worsen, and I’ve also seen families relieved when a chart helped them act fast. Knowledge is care: the ability to spot severity at a glance can prevent complications, speed up recovery, and even save lives.
Next Steps
Keep a burn chart handy. Print one for your kit and save one digitally.
Know the signs. Redness, blisters, leathery skin—each signals a different burn level.
Prepare a kit. Stock gauze, burn gel, and non-stick dressings.
Recognize emergencies. Burns larger than your palm, or on sensitive areas, need hospital care.
Practice and share. Review charts with family or coworkers so everyone can respond quickly.
Action Point: Preparation isn’t optional. Equip your home and workplace with a burn chart, first-aid kit, hydrogel dressing, and shared knowledge.
Keep a burn chart handy. Print one for your kit and save one digitally.
Know the signs. Redness, blisters, leathery skin—each signals a different burn level.
Prepare a kit. Stock gauze, burn gel, and non-stick dressings.
Recognize emergencies. Burns larger than your palm, or on sensitive areas, need hospital care.
Practice and share. Review charts with family or coworkers so everyone can respond quickly.


